QLiss3D - Lissajous Figures
 |
 |
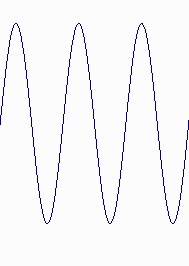
This is the graph of a sine function. The x value is increasing continiously
while the y value is the result of sin(x).
|
 |
|
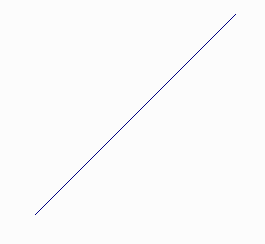
In this picture you can see a very simple Lissajous figure. Y- and x-frequency are the same.
Both x- and y-values of the painted pixels are results of sin(i), where i is
an increasing counting variable.
|
 |
|
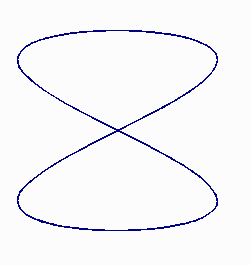
Here the x-frequency is twice as high as the y-frequency and the resulting Lissajous figure
consists of points with the coordinates (sin(2i)|sin(i)). |
QLiss3D adds a third dimension with a third frequency to these Lissajous figures.
A good introduction to Lissajous curves can be found in Wikipedia.
|